3.20. Experiments
This notebook documents the use of the Experiment class for running many experiments, and comparing the results.
In [1]:
import conx as cx
Using TensorFlow backend.
Conx, version 3.6.0
First, we create an experiment object:
In [11]:
exp = cx.Experiment("XOR-Test1")
Experiment takes a function, and any number of variations of values.
The function takes whatever argumnets you wish, creates a network, trains it, and returns the network and a category describing the run:
In [12]:
def function(optimizer, activation, **options):
    category = "%s-%s" % (optimizer, activation)
    print("category %s running..." % category)
    net = cx.Network("XOR", 2, 2, 1, activation=activation)
    net.compile(error="mse", optimizer=optimizer)
    net.dataset.append_by_function(2, (0, 4), "binary", lambda i,v: [int(sum(v) == len(v))])
    net.train(report_rate=10000, verbose=0, plot=False, **options)
    return category, net
Then we run a number of trials (perhaps just 1). Notice that each argument should be given as a list. The total number of runs per trial is the product of the lengths of the arguments.
In [13]:
exp.run(function,
        trials=2,
        epochs=[1000],
        accuracy=[0.8],
        tolerance=[0.2],
        optimizer=["adam", "sgd"],
        activation=["sigmoid", "relu"],
        dir="/tmp/")
category adam-sigmoid running...
category sgd-sigmoid running...
category adam-relu running...
category sgd-relu running...
category adam-sigmoid running...
category sgd-sigmoid running...
category adam-relu running...
category sgd-relu running...
The results is a list of (category, network-name) pairs:
In [14]:
exp.results
Out[14]:
[('adam-sigmoid', '/tmp/XOR-Test1-00001-00001'),
 ('sgd-sigmoid', '/tmp/XOR-Test1-00001-00002'),
 ('adam-relu', '/tmp/XOR-Test1-00001-00003'),
 ('sgd-relu', '/tmp/XOR-Test1-00001-00004'),
 ('adam-sigmoid', '/tmp/XOR-Test1-00002-00001'),
 ('sgd-sigmoid', '/tmp/XOR-Test1-00002-00002'),
 ('adam-relu', '/tmp/XOR-Test1-00002-00003'),
 ('sgd-relu', '/tmp/XOR-Test1-00002-00004')]
Often, you may wish to plot the results of learning. This may take some time, as the function will re-load each network:
In [15]:
exp.plot("loss")
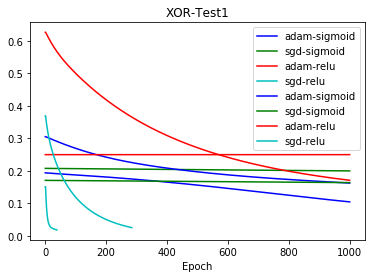
Notice that each category has its own color.
There is also a generic apply method for calling a function with each of the (category, network-names). Ususally, you would probably want to re-load the network, and perform some operation in the function.
In [16]:
exp.apply(lambda category, exp_name: (category, exp_name))
Out[16]:
[('adam-sigmoid', '/tmp/XOR-Test1-00001-00001'),
 ('sgd-sigmoid', '/tmp/XOR-Test1-00001-00002'),
 ('adam-relu', '/tmp/XOR-Test1-00001-00003'),
 ('sgd-relu', '/tmp/XOR-Test1-00001-00004'),
 ('adam-sigmoid', '/tmp/XOR-Test1-00002-00001'),
 ('sgd-sigmoid', '/tmp/XOR-Test1-00002-00002'),
 ('adam-relu', '/tmp/XOR-Test1-00002-00003'),
 ('sgd-relu', '/tmp/XOR-Test1-00002-00004')]